
NDT technical guide and eddy current lexicon — English
- Leonardo Felipe
- Jul 26
- 25 min read
A continuous educational reference covering NDT fundamentals, method selection, instrumentation, setup, acquisition, interpretation, applications, and limitations. This content does not replace a qualified procedure, applicable standard, or engineering assessment.
See beyond the surface.
A bilingual technical center for understanding the physics, instrumentation, data, applications, and limitations of NDT methods and complementary material-characterization techniques.
Choose the area. Understand the physics. Interpret the signal.
Each technique is organized as a continuous reference page with every subtopic in one place: fundamentals, system, setup, inspection workflow, applications, advantages, and limitations.
01 — NDT Foundations
Shared language, method selection, reliability, and decision workflow.
01.1 — NDT explained (NDT)
Principles, selection, and reliability
Nondestructive testing comprises methods that examine materials, components, and structures without impairing their future use. Each method interacts with the part through a different physical principle and is therefore sensitive to specific discontinuities.

Phased array ultrasonic weld inspection. — Evident Scientific — source: https://ims.evidentscientific.com/en/products/phased-array/omniscan-x4
Technical reference image. Credit and a link to the official source are shown in the entry.
• Objective: Detect, locate, measure, or characterize
• Test object: Materials, parts, welds, and structures
• Result: Indication evaluated against a criterion
• Core rule: No single method sees everything
Indication, discontinuity, and defect
Precision starts with language. The instrument presents a response; technical evaluation determines what it means.
• Indication: a response observed or recorded by the system.
• Discontinuity: a physical or metallurgical interruption that may explain the response.
• Defect: a discontinuity that fails to meet the applicable acceptance criterion.
• An indication should not be called a crack before characterization.
Method families
The energy used defines the information available and the conditions required to obtain it.
• Visual: surface-breaking conditions accessible to the line of sight.
• Electromagnetic: conductive materials, fields, amplitude, and phase.
• Ultrasonic: transit time, reflection, interfaces, and internal volume.
• Magnetic: flux disturbances in ferromagnetic materials.
How to select a method
Selection starts with the inspection question, not with the available instrument.
• Material, microstructure, thickness, and geometry.
• Expected discontinuity size, depth, and orientation.
• Access, temperature, coating, and surface condition.
• Coverage, speed, data recording, code, and acceptance criterion.
Reliability and capability
A negative result means no indications above the demonstrated capability and procedural threshold—not an absolute absence of damage.
• Probability of detection depends on physical contrast, coverage, orientation, and noise.
• Reference blocks and samples demonstrate the expected response.
• Checks before, during, and after inspection preserve traceability.
• Inspector competence and the procedure are part of the measurement system.
Inspection workflow
1. Define the objective, damage mechanism, and evaluation criterion.
2. Select the method, technique, equipment, and reference.
3. Prepare access, surface, and safety conditions.
4. Set up, calibrate/verify, and demonstrate capability.
5. Acquire data with coverage and traceability.
6. Interpret, evaluate, record, and report.
Where it excels
• Preserves component function.
• Applicable during manufacture and in service.
• Enables complementary methods to be combined.
Critical limitations
• Capability is specific to each method-and-application combination.
• Results depend on the procedure, reference, and operator.
• Acceptance criteria come from code or engineering, not the instrument.
Parameters governing the result
• Material
• Geometry
• Orientation
• Coverage
• Signal-to-noise
• Criterion
Typical applications
• Quality control
• Asset integrity
• Welds and fabrication
• Predictive maintenance
• Aerospace
• Energy and oil & gas
02 — Electromagnetic Methods
Eddy current, arrays, and magnetic flux leakage for surfaces and metal loss.
02.1 — Eddy current testing (ECT)
Induction, impedance, frequency, and phase
An alternating-current coil induces currents in a conductive material. Cracks and changes in geometry, conductivity, permeability, or lift-off modify probe impedance; the instrument displays that change in amplitude and phase.

Eddyfi Ectane 3 multitechnology instrumentation. — Eddyfi Technologies — source: https://www.eddyfi.com/en/product/ectane-3
Technical reference image. Credit and a link to the official source are shown in the entry.
• Energy: Electromagnetic induction
• Materials: Electrically conductive
• Best response: Surface and shallow subsurface
• Data: Impedance plane / time
Formula: δ ≈ 503 / √(f · μᵣ · σ)
Standard depth δ in mm, with f in Hz and σ in MS/m. About 36.8% of current density remains at 1δ and roughly 5% at 3δ. It is a physical reference, not a detection guarantee.
Primary field, currents, and secondary field
The coil produces an alternating field. Currents induced in the part create an opposing field that acts back on the coil.
• Impedance combines resistance and reactance: Z = R + jX.
• A crack interrupts current flow and changes amplitude and phase.
• The skin effect concentrates current near the surface.
• Higher frequency increases surface sensitivity and reduces penetration.
Probe configurations
Coil geometry defines the interrogated volume, the most sensitive direction, and signal shape.
• Absolute: sensitive to gradual changes and lift-off; more prone to drift.
• Differential: compares nearby regions and enhances localized discontinuities.
• Pencil/surface, encircling, bobbin, segment, and rotating probes.
• Pitch-catch separates excitation and reception to control the field path.
Impedance plane and filters
The X–Y vector enables responses to be separated by phase when their physical mechanisms differ.
• The lift-off signal is acquired and used as a phase reference.
• High-pass reduces slow changes; low-pass reduces fast noise.
• Time-domain filters depend on scan speed.
• Multifrequency testing helps separate discontinuity and geometry.
Setup and reference
Setup should be built on a standard representative of the alloy, geometry, finish, and discontinuities of interest.
• Record reference, lift-off, edge, and geometry signals.
• Set gain, phase, and filters without distorting the relevant signal.
• Validate coverage, speed, and repeatability.
• Amplitude alone does not directly equal depth.
Inspection workflow
1. Define material, geometry, and likely discontinuity orientation.
2. Select probe, configuration, and frequency range.
3. Balance and set up on a representative standard.
4. Establish lift-off, phase, gain, filters, and thresholds.
5. Scan with controlled speed, pressure, and coverage.
6. Interpret amplitude, phase, shape, and position; record.
Where it excels
• No couplant and limited preparation.
• High sensitivity to surface cracks.
• Immediate response and high speed.
• Straightforward automation integration.
Critical limitations
• Conductive materials only.
• Depth limited by the skin effect.
• Edges, holes, lift-off, and permeability can dominate the signal.
• Crack orientation strongly affects sensitivity.
Parameters governing the result
• Frequency
• Conductivity
• Permeability
• Lift-off
• Coil diameter
• Speed
• Phase
• Filters
Typical applications
• Aircraft and fastener cracks
• Heat-exchanger tubes
• Bars, wire, and tubes
• Conductivity and alloy sorting
• Nonconductive coating
• Metallurgical changes and grinding burn with application-specific technique and calibration
02.2 — Eddy current array (ECA)
Multiplexed coverage and C-scan maps
ECA combines multiple eddy current elements in one probe. Electronics switch individual elements or groups in sequence, increasing inspection width and, when paired with an encoder, building two-dimensional response maps.

Sharck probes for ECA/TECA inspection. — Eddyfi Technologies — source: https://www.eddyfi.com/en/product/sharck-probes
Technical reference image. Credit and a link to the official source are shown in the entry.
• Architecture: Multiple elements + MUX
• Coverage: Wide swath per pass
• Position: Encoder recommended
• Data: C-scan + impedance plane
What changes from conventional ECT
The primary gain comes from physical element coverage and switching—not acoustic focusing.
• Each element produces a local amplitude-and-phase response.
• Single, multiple, or staggered rows reduce unexamined strips.
• Rigid arrays offer stability; flexible arrays conform to curvature.
• ECA does not electronically steer a beam like PAUT.
Multiplexing and data rate
The multiplexer divides time among channels. Its rate must match speed, element count, and spatial resolution.
• Sensor MUX: switches elements using the same parameter set.
• Parameter MUX: alternates frequency, filter, phase, or threshold.
• More channels per cycle can reduce samples per element.
• Insufficient rate can create gaps along the scan direction.
Normalization and channel health
The probe must respond uniformly across its full width before the map is interpreted.
• Equalize gain and phase element by element.
• Detect dead, noisy, or saturated channels.
• Control pressure and lift-off across the full width.
• Verify encoder, spatial pitch, and reference standard.
C-scan and interpretation
A C-scan maps channel and position to color. The map must state exactly which variable it represents.
• It may map amplitude, phase, X, Y, mix, or classification.
• Scale, unit, direction, and resolution must be visible.
• Encoder error distorts length and position.
• A colored region is an indication, not automatically a crack.
Inspection workflow
1. Select array, frequency, topology, and mechanical guide.
2. Normalize channels and verify elements.
3. Set lift-off, phase, gain, and MUX scheme.
4. Verify the full width on a representative standard.
5. Perform encoded scanning with defined overlap.
6. Analyze C-scan and impedance plane; retain raw data.
Where it excels
• Wide coverage while retaining resolution.
• Position recording and intuitive C-scan.
• Fewer passes and lower risk of missed strips.
• Strong fit for automation and curved surfaces.
Critical limitations
• Trade-off among channels, MUX, speed, and density.
• Requires channel equalization and monitoring.
• Uneven conformity and crosstalk create artifacts.
• A convincing map does not replace qualification.
Parameters governing the result
• Pitch
• Active width
• MUX rate
• Speed
• Encoder
• Conformity
• Normalization
• Crosstalk
Typical applications
• Airframes and rivet rows
• Bearings and wheels
• Curved surfaces
• Detection and mapping of surface or shallow subsurface corrosion under a qualified procedure
• Rails and plate
• Production parts and automation
02.3 — Magnetic flux leakage (MFL)
Rapid metal-loss screening
MFL magnetizes a ferromagnetic component. Section loss locally increases reluctance and forces part of the flux outside the steel; near-surface sensors record this leakage and, with encoded position, form a map.
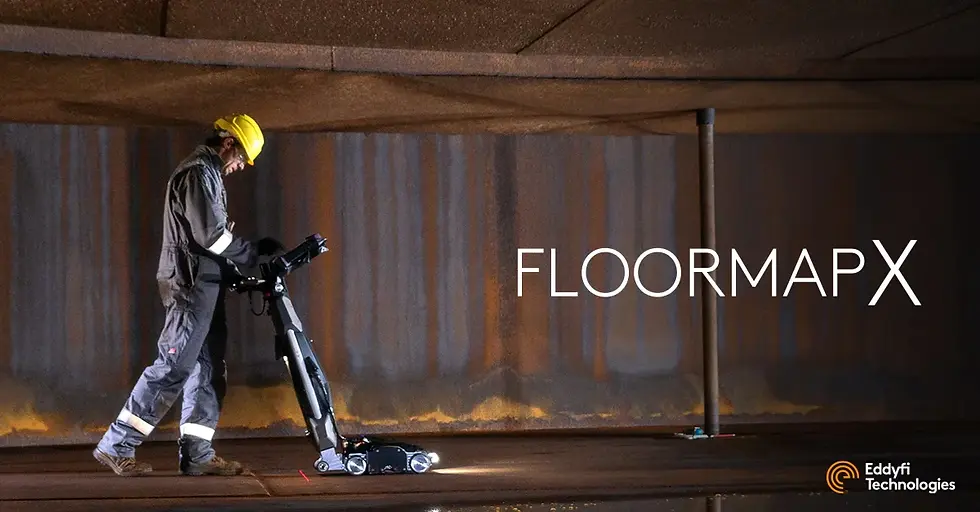
FloormapX MFL array scanner. — Eddyfi Technologies — source: https://www.eddyfi.com/en/product/floormapx-mfl-tank-bottom-inspection
Technical reference image. Credit and a link to the official source are shown in the entry.
• Energy: Steel magnetization
• Materials: Ferromagnetic
• Best response: Localized or generalized metal loss
• Data: Leakage map + UT prove-up
Magnetization and leakage
In uniform, adequately magnetized plate, most flux remains in the steel. A reduction in section diverts the field.
• Permanent magnets, electromagnets, or yokes establish flux.
• Hall or magnetoresistive sensors measure leakage-field components.
• Magnetization orientation affects response to damage geometry.
• Insufficient or variable magnetization reduces repeatability.
System and encoded acquisition
The scanner combines magnetization, a sensor array, lift-off control, and position.
• Pole pieces/shoes transfer flux into the component.
• Wheels or skids stabilize sensor-to-surface distance.
• An encoder turns successive samples into a spatial map.
• A reference piece demonstrates setup capability.
Response is not direct thickness
Amplitude depends on depth, width, length, orientation, volume, lift-off, speed, permeability, and magnetization.
• The same lost volume can produce different signals.
• Narrow, deep pits are particularly difficult to size.
• Tank-floor MFL is primarily screening and mapping.
• Relevant indications are commonly proved up by UT.
Geometry, surface, and blind zones
Welds, edges, patches, obstacles, and coating create their own responses or reduce coverage.
• Debris at the poles and scale alter lift-off.
• Nonmagnetic coating reduces sensitivity if not represented.
• Near-side and far-side signals may be difficult to distinguish.
• Crack capability must not be inferred from corrosion capability.
Inspection workflow
1. Define expected damage, material, thickness, and coverage.
2. Clean, grid, and mark welds/obstacles.
3. Select magnetization, sensors, speed, and resolution.
4. Verify performance on a representative reference.
5. Scan with controlled contact, direction, and overlap.
6. Map indications, prove up with UT, and report uncovered zones.
Where it excels
• High coverage over large surfaces.
• Sensitive to near- or far-side loss.
• No liquid couplant.
• Excellent pairing with UT prove-up.
Critical limitations
• Restricted to ferromagnetic materials.
• Does not directly measure remaining thickness.
• Welds, edges, coating, and speed affect the signal.
• Strong magnets require specific safety controls.
Parameters governing the result
• Saturation
• Field orientation
• Lift-off
• Speed
• Sensor pitch
• Thickness
• Permeability
• Encoder
Typical applications
• Tank floors
• Pipeline in-line inspection
• Ferromagnetic tubes and bars
• Steel wire ropes
• Plate and structures
• Production lines
03 — Ultrasonic Methods
Thickness, flaw detection, and phased array imaging.
03.1 — Ultrasonic thickness measurement (UTM)
Transit time and remaining wall thickness
The instrument measures the round-trip time of a pulse between the entry surface and the opposite wall. Knowing the material sound velocity, it converts the path into thickness.
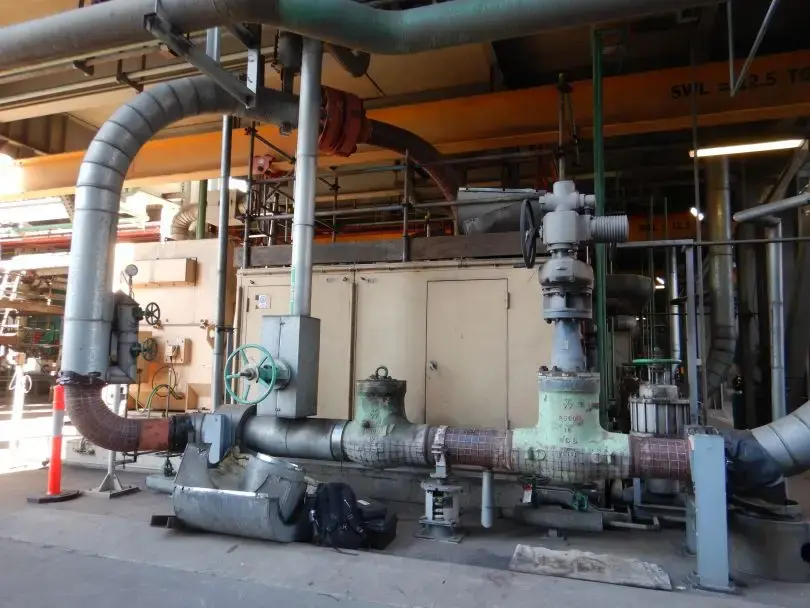
Thickness measurement applied to asset integrity. — Evident Scientific — source: https://ims.evidentscientific.com/en/insights/the-38dl-plus-ultrasonic-thickness-gauge-is-an-asset-to-asset-reliability-inspections
Technical reference image. Credit and a link to the official source are shown in the entry.
• Principle: Pulse-echo
• Access: Usually one side
• Measures: Time → thickness
• Data: Reading, A-scan, or map
Formula: T = V · t / 2
T is thickness, V is sound velocity in the material, and t is round-trip time. Velocity error becomes proportional thickness error.
Pulse-echo and coupling
The piezoelectric transducer transmits and receives. The opposite-wall echo defines the measurement interval.
• An air interface reflects nearly all MHz ultrasonic energy and prevents reliable coupling; couplant is therefore used.
• The opposite wall must return an identifiable echo.
• Nonparallel surfaces can redirect the echo.
• The A-scan helps confirm that the correct echo was measured.
Transducers and modes
Frequency, diameter, construction, and mode are selected for material, curvature, range, and surface condition.
• Dual element: robust for corrosion and pitting.
• Single element, delay line, and immersion: precision and thin parts.
• Mode 1 measures from the initial pulse to the first back-wall echo.
• Mode 2 measures from the interface echo to the first back-wall echo and is used with delay-line or immersion setups.
• Mode 3 measures between successive back-wall echoes; it offers good resolution but requires clean multiple echoes.
Calibration and coatings
Velocity and zero must represent the material, transducer, and thickness range.
• Use a representative reference and verify on known thicknesses.
• Recalibrate after changing material, probe, or temperature.
• Paint can falsely increase the metal reading.
• Echo-to-echo or specific techniques separate coating when applicable.
Factors affecting the reading
A digital reading must be understood within its physical measurement chain.
• Roughness, scale, external corrosion, and curvature.
• Temperature and sound-velocity variation.
• Attenuation, scattering, and coarse microstructure.
• Unstable coupling and incorrect echo selection.
Inspection workflow
1. Define material, range, condition, and through-coating need.
2. Select transducer, frequency, and mode.
3. Prepare points or a grid and establish traceability.
4. Calibrate velocity and zero on an appropriate reference.
5. Verify coupling and echo on the A-scan.
6. Record readings, confirm minima, and map trends.
Where it excels
• Measures from one side.
• Quantitative thickness reading.
• Applicable to many engineering solids.
• Enables corrosion grids and maps.
Critical limitations
• Requires coupling and a reliable back-wall echo.
• Incorrect velocity creates systematic error.
• Attenuating materials or poor surfaces limit the method.
• A point reading may not represent a localized pit.
Parameters governing the result
• Sound velocity
• Zero
• Frequency
• Diameter
• Mode
• Temperature
• Couplant
• Back-wall echo
Typical applications
• Piping and vessels
• Tanks and plate
• Corrosion and erosion
• Plastics and glass
• Thin parts and ceramics
• Dimensional control
03.2 — Ultrasonic flaw detection (UT)
Reflection, location, and evaluation
Conventional UT analyzes echoes from interfaces, geometry, and discontinuities. Arrival time helps locate the reflector; echo amplitude, waveform shape, and response to probe movement support evaluation but do not directly represent its true size.

Portable instrumentation for conventional UT. — Evident Scientific — source: https://ims.evidentscientific.com/en/products/flaw-detectors/epoch-650
Technical reference image. Credit and a link to the official source are shown in the entry.
• Energy: Mechanical waves
• Range: Internal volume and interfaces
• Primary data: A-scan
• Reference: Blocks and known reflectors
Waves, impedance, and reflection
Ultrasonic waves reflect at acoustic-impedance changes and refract when crossing oblique interfaces.
• Longitudinal: particle motion parallel to propagation.
• Shear: perpendicular motion; exists in solids.
• Surface/Rayleigh: concentrated near the surface.
• High frequency improves resolution; low frequency improves penetration.
Beam and A-scan
The A-scan presents amplitude vertically and time or distance horizontally.
• Pulser, receiver, gain, filters, gates, and time base form the chain.
• The near field has maxima and minima; the far field diverges.
• Gates isolate regions and may trigger alarms.
• Amplitude varies with orientation, distance, attenuation, and coupling.
Straight beam, angle beam, and welds
Beam direction is selected to intercept the likely discontinuity orientation.
• Straight beam: laminations, voids, forgings, and back-wall echoes.
• Angle wedge: refraction and mode conversion for weld inspection.
• Geometric root/cap echoes must be recognized.
• A poorly oriented crack may return a very small echo.
Calibration and sizing
Position and amplitude response are compared with references established by the procedure.
• Velocity/zero establish position and sound path.
• DAC/TVG compensate for path-dependent response.
• DGS/AVG provides equivalent reflector size, not literal geometry.
• 6 dB drop and probe movement depend on beam shape.
Inspection workflow
1. Define component, volume, orientation, and code.
2. Select frequency, diameter, mode, and angle.
3. Calibrate time base, sensitivity, and reference.
4. Plan probe positions and coverage.
5. Scan while maintaining coupling and movement pattern.
6. Locate, characterize, size per procedure, and record.
Where it excels
• Good penetration and depth information.
• Detection of internal discontinuities.
• Portable equipment and immediate response.
• Broad base of procedures and applications.
Critical limitations
• Reflector orientation is critical.
• Geometry and microstructure create noise and echoes.
• Interpretation and sizing require high competence.
• Dead zone and poor surface limit near-surface regions.
Parameters governing the result
• Wave mode
• Frequency
• Diameter
• Angle
• Gain
• Gate
• DAC/TVG
• Coupling
Typical applications
• Welds
• Forgings and castings
• Shafts, pins, and bolts
• Plate and laminations
• Composites and bonds
• Rails and wheels
03.3 — Phased array ultrasonic testing (PAUT)
Beam formation, focusing, and imaging
PAUT uses multiple individually controlled piezoelectric elements. On transmit, controlled element delays make the wavefronts interfere and form the beam. On receive, signals from individual elements are time-shifted and electronically summed.
Phased array ultrasonic weld inspection. — Evident Scientific — source: https://ims.evidentscientific.com/en/products/phased-array/omniscan-x4
Technical reference image. Credit and a link to the official source are shown in the entry.
• Transducer: Element array
• Control: Focal laws
• Scans: Linear, sectorial, and encoded
• Data: A-, B-, C-, and S-scan
Elements, pitch, and aperture
The probe contains small elements. An active group forms the aperture used by each focal law.
• Pitch is the center-to-center spacing between elements.
• A larger aperture increases energy and focusing capability.
• Smaller elements favor steering.
• Wedge and material turn delays into angle and focus.
Focal laws and beamforming
Laws calculate transmit-and-receive delays for an angle, position, and focal depth.
• Constructive interference creates the main lobe.
• S-scan varies angle; linear scan shifts the aperture.
• Incorrect wedge, velocity, or geometry data misplace the image.
• Useful focusing is limited by the available near field.
Imaging and encoded position
Each format reorganizes A-scans to answer a different spatial question.
• A-scan: amplitude versus time.
• B-scan: section along a line.
• C-scan: planar view encoded by position.
• S-scan: sectorial section formed by multiple angles.
Calibration and artifacts
The full sequence needs consistent position and sensitivity across elements and laws.
• Element normalization and per-law sensitivity.
• Velocity, zero, angle, offsets, and wedge height.
• Side lobes and grating lobes can create spurious indications.
• An image does not replace A-scan and geometry validation.
Inspection workflow
1. Define geometry, volume, discontinuity, and code.
2. Select probe, wedge, frequency, pitch, and aperture.
3. Create focal laws and simulate coverage.
4. Calibrate position, sensitivity, and encoder.
5. Perform encoded scanning and verify coupling.
6. Review A-/S-/B-/C-scans, characterize, and report.
Where it excels
• Multiple angles with one probe.
• Electronic focusing and coverage.
• Encoded, traceable imaging.
• Strong coverage of complex geometries.
Critical limitations
• Higher setup complexity, cost, and training.
• Bad inputs create convincing but incorrect images.
• Lobes, saturation, and artifacts must be recognized.
• Retains conventional UT acoustic limitations.
Parameters governing the result
• Pitch
• Aperture
• Delays
• Focus
• Angle
• Wedge
• Encoder
• Resolution
Typical applications
• Pipeline welds
• Structures and vessels
• Corrosion mapping
• Aerospace
• Complex forgings
• Bonds and composites
04 — Surface and Materials
Direct/remote visual inspection and portable hardness characterization.
04.1 — Portable hardness testing (HT)
UCI, Leeb, and portable indentation
Hardness is method-dependent: indenter, load, cycle, material, and preparation matter. Portable tests evaluate a localized surface region and leave a small indentation; they do not reveal internal discontinuities.
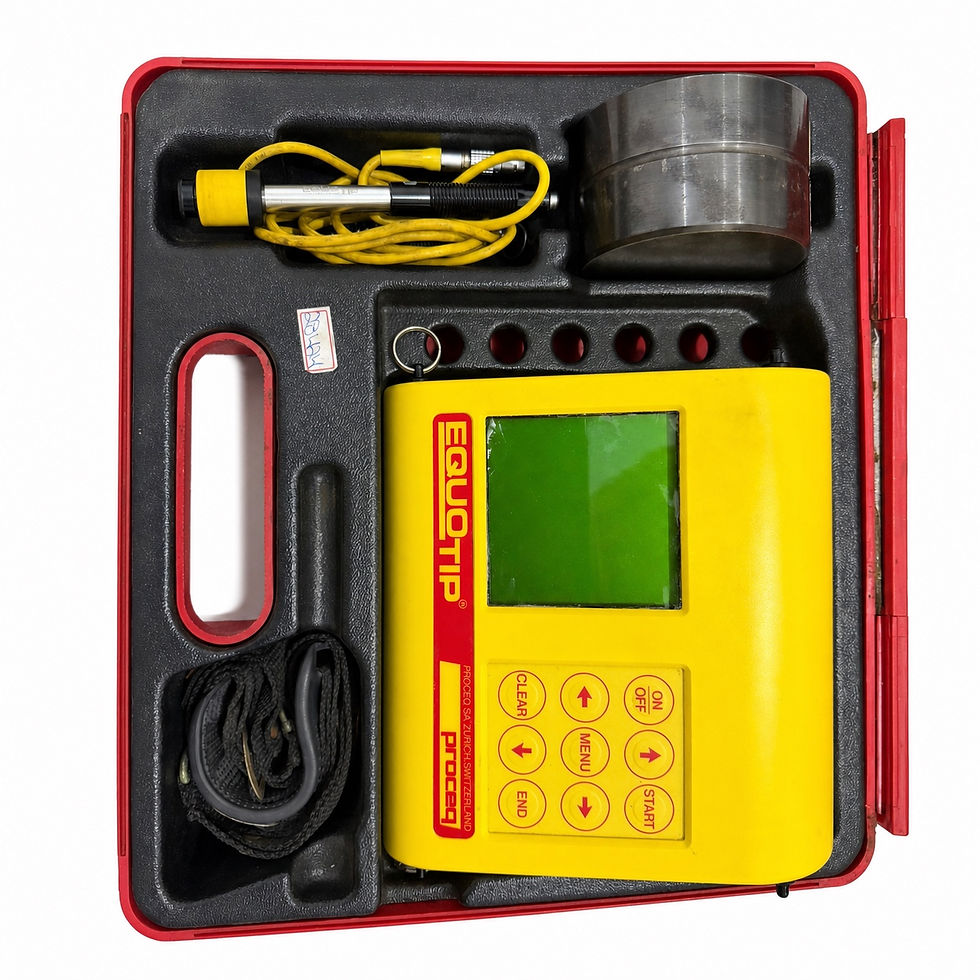
Example of portable instrumentation for Leeb hardness testing. — SmartEND Instruments
Technical reference image. Credit and a link to the official source are shown in the entry.
• Nature: Minimally invasive
• Region: Localized surface
• Methods: UCI, Leeb, Rockwell
• Rule: Always report the native scale
UCI — ultrasonic contact impedance
A resonating rod with a Vickers diamond changes frequency as contact area increases under controlled load.
• Useful on welds, HAZ, gears, and small areas.
• Requires perpendicularity and stable force.
• Elastic modulus and material family influence conversion.
• Roughness, curvature, thickness, and support affect the reading.
Leeb — dynamic rebound
An impact body strikes the surface; the instrument compares rebound and impact velocity.
• HL = 1000 × rebound velocity / impact velocity.
• Suited to heavy parts, castings, forgings, shafts, and rolls.
• The device is part of the result: HLD, HLC, HLG, etc.
• Mass, stiffness, direction, curvature, and gravity are critical.
Portable Rockwell, Vickers, and Brinell
Direct indentation methods are selected when scale, indentation, and geometry are compatible.
• Rockwell uses depth change under controlled loads.
• Vickers measures diagonals of a pyramidal indentation.
• Brinell uses a ball and larger indentation in heterogeneous materials.
• Portable results are not automatically equivalent to a bench machine.
Conversions and reporting
Conversions among HV, HBW, HRC, HRB, and strength depend on the exact material family.
• Report the native value and complete method first.
• Identify load, probe, or impact device.
• Keep measured values separate from converted values.
• Record individual readings, mean, scatter, and location.
Inspection workflow
1. Define material, condition, objective, and required scale.
2. Select method, load, probe, or device.
3. Check mass, thickness, curvature, and support.
4. Prepare without heating or work-hardening the surface.
5. Verify on a block and perform the point pattern.
6. Review scatter, recheck, and report the native scale.
Where it excels
• Measurement on installed or large parts.
• Weld, base metal, and HAZ mapping.
• Localized heat-treatment verification.
• Rapid field results.
Critical limitations
• Assesses only a localized surface region.
• Leaves a small permanent indentation.
• Poor preparation and support invalidate results.
• Conversions are material-dependent.
Parameters governing the result
• Scale
• Load
• Indenter
• Roughness
• Mass
• Support
• Curvature
• Temperature
Typical applications
• Weld and HAZ
• Heat treatment
• Gears and shafts
• Castings and forgings
• Rolls and tooling
• Supporting assessment of hardness changes associated with thermal exposure
04.2 — Direct and remote visual inspection (VT / RVI)
Access, optics, imaging, and measurement
Direct visual testing examines surfaces accessible to the line of sight. RVI extends that reach with cameras, borescopes, fiberscopes, and videoscopes, enabling cavity inspection without extensive disassembly.
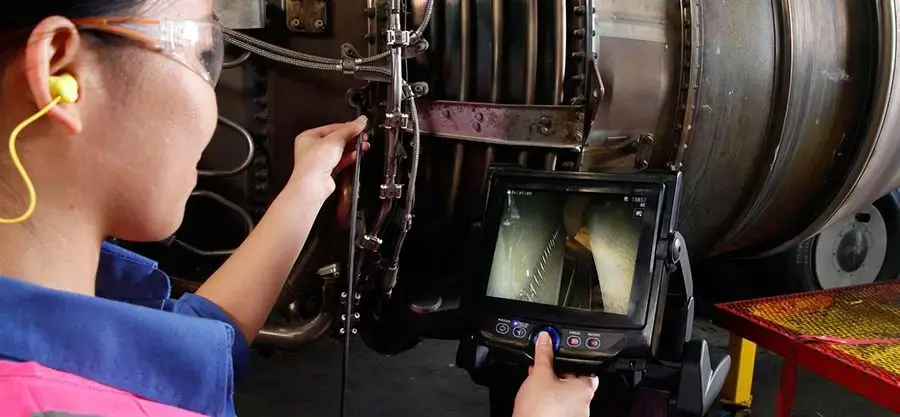
RVI application on turbine components. — Evident Scientific — source: https://ims.evidentscientific.com/en/applications/maintaining-uptime-in-turbine-inspections-using-the-iplex-nx-videoscope
Technical reference image. Credit and a link to the official source are shown in the entry.
• Energy: Visible light and imaging
• Detects: Visible surface conditions
• Access: Direct or via optical probe
• Record: Photo, video, and measurement
Direct versus remote
Direct inspection uses vision, lighting, and aids. Remote inspection brings a camera or optical system to an inaccessible region.
• Direct: eye, magnifier, mirror, ruler, and camera.
• Rigid borescope: high quality through straight access.
• Fiberscope: coherent fiber bundle and small diameter.
• Videoscope: tip sensor, illumination, articulation, and recording.
Optical and access selection
Diameter, length, viewing direction, field of view, and depth of field must match the route and target.
• Forward- or side-viewing tip according to geometry.
• Near or far focus according to target distance and the required level of detail.
• Illuminance, observation distance, and viewing angle must meet the procedure.
• Temperature, pressure, and chemical compatibility limit the probe.
• Articulation and bend radius govern navigation.
Procedure and coverage
A sharp image without positional traceability is not, by itself, a complete inspection.
• Prepare access and clean the region where possible.
• Insert slowly without forcing the tube.
• Control orientation, lighting, focus, and speed.
• Record position, scale, extent, and coverage.
• Verify the measurement system and meet visual-acuity and qualification requirements.
Measurement and interpretation
Comparison, shadow, laser, stereo, or 3D reconstruction can quantify visible indications.
• Perspective without scale distorts size and depth.
• Measurement depends on calibration, distance, and correct point selection.
• Glare, dirt, oil, and vapor can mask indications.
• Visual testing does not demonstrate absence of subsurface damage.
Inspection workflow
1. Define target, access route, and condition sought.
2. Select camera/optics, tip, length, and illumination.
3. Check environment, cleanliness, focus, and scale.
4. Navigate a defined sequence, slowly and without forcing.
5. Capture identified images and measure where applicable.
6. Record coverage, limitations, location, and result.
Where it excels
• Immediate visual result.
• Limited preparation in simple applications.
• Cavity access without full disassembly.
• Photo, video, and measurement record.
Critical limitations
• Visible conditions only.
• Depends on line of sight and a physical route.
• Lighting, cleanliness, and perspective affect evaluation.
• Incomplete coverage can go unnoticed.
Parameters governing the result
• Illuminance
• Distance
• Angle
• Focus
• Field of view
• Depth of field
• Scale
• Coverage
Typical applications
• Turbines and engines
• Piping and vessels
• Welds and fabrication
• Gearboxes
• Castings and automotive
• Hazardous or remote spaces
The right method depends on the inspection question.
The table summarizes the typical capability of each technique. It does not replace performance demonstration, the governing code, or a qualified procedure.
VT / RVI
• Material: Any visible surface
• Primary sensitivity: Surface-breaking conditions and appearance
• Typical access: Line of sight or optical route
• Output: Image / video / measurement
ECT
• Material: Conductors
• Primary sensitivity: Surface and shallow cracks
• Typical access: One side, little or no contact
• Output: Amplitude and phase
ECA
• Material: Conductors
• Primary sensitivity: Surface and shallow subsurface with wide coverage
• Typical access: One side; encoder for positional mapping
• Output: C-scan + impedance
MFL
• Material: Ferromagnetic
• Primary sensitivity: Localized or generalized metal loss
• Typical access: One side, contact scanner
• Output: Screening map
UTM
• Material: Acoustically transmissive solids
• Primary sensitivity: Thickness / opposite wall
• Typical access: One side + couplant
• Output: Thickness / map
UT
• Material: Engineering solids
• Primary sensitivity: Internal reflectors
• Typical access: One side + couplant
• Output: A-scan
PAUT
• Material: Engineering solids
• Primary sensitivity: Multi-angle volumetric coverage
• Typical access: One side + couplant; scanner/encoder for encoded data
• Output: A/B/C/S-scan
HT
• Material: Metals and compatible materials
• Primary sensitivity: Surface mechanical response
• Typical access: Prepared local contact
• Output: Hardness scale
Original content, verifiable principles.
The copy was written for this guide using recognized technical and manufacturer sources. The references below informed the taxonomy and conceptual verification; no content was reproduced verbatim.
• Evident NDT Learning Center (https://ims.evidentscientific.com/en/learn): Learning architecture and method overview.
• Evident — Ultrasonic Thickness Gauge Tutorial (https://ims.evidentscientific.com/en/learn/ndt-tutorials/thickness-gauge): Principle, transducers, modes, calibration, and influencing factors.
• Evident — Ultrasonic Flaw Detection Tutorial (https://ims.evidentscientific.com/en/learn/ndt-tutorials/flaw-detection): Ultrasonic theory, instrumentation, welds, and sizing.
• Evident — Phased Array Tutorial (https://ims.evidentscientific.com/en/learn/ndt-tutorials/phased-array): Elements, focal laws, beamforming, imaging, and calibration.
• Evident — Eddy Current Array Tutorial (https://ims.evidentscientific.com/en/learn/ndt-tutorials/eca-tutorial): Arrays, multiplexing, probes, and C-scan.
• Evident — Remote Visual Inspection (https://ims.evidentscientific.com/en/learn/remote-visual-inspection): RVI, equipment, optical selection, and use workflow.
• Rohmann — Eddy Current Lexicon (https://www.rohmann.de/en/eddy-current-lexicon/): ECT reference: impedance, sensors, filters, depth, and MUX.
• ISO — Standards catalogue (https://www.iso.org/standards.html): Current technical-standard edition lookup.
• ASTM International — Standards (https://www.astm.org/products-services/standards-and-publications/standards.html): References for ECT, MFL, and portable hardness.
• HSE — Inspection and Nondestructive Testing (https://www.hse.gov.uk/comah/sragtech/techmeasndt.htm): Capabilities and limitations of MFL as a screening technique.
• ASTM A1038 — Portable Hardness by UCI (https://store.astm.org/a1038-26.html): Practice for portable hardness measurement by the UCI method.
• ASTM A956/A956M — Leeb Hardness (https://store.astm.org/a0956_a0956m-22.html): Portable Leeb rebound method for steel products.
• ASTM E110 — Portable Indentation Hardness (https://store.astm.org/standards/e110): Requirements for hardness by portable indentation equipment.
Important technical note
This material is educational. Method selection, calibration, personnel qualification, acceptance criteria, and safety must follow the written procedure, contractual code, and current edition of applicable standards. An indication is not automatically a defect.
Additional visual resources
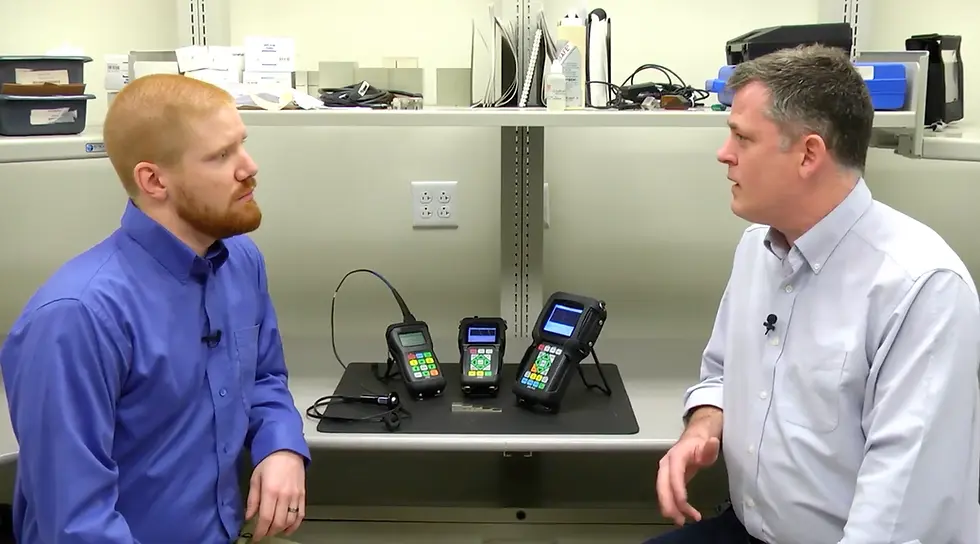
Portable instrumentation used across multiple NDT methods. — Evident Scientific — source: https://ims.evidentscientific.com/en/learn/nondestructive-testing
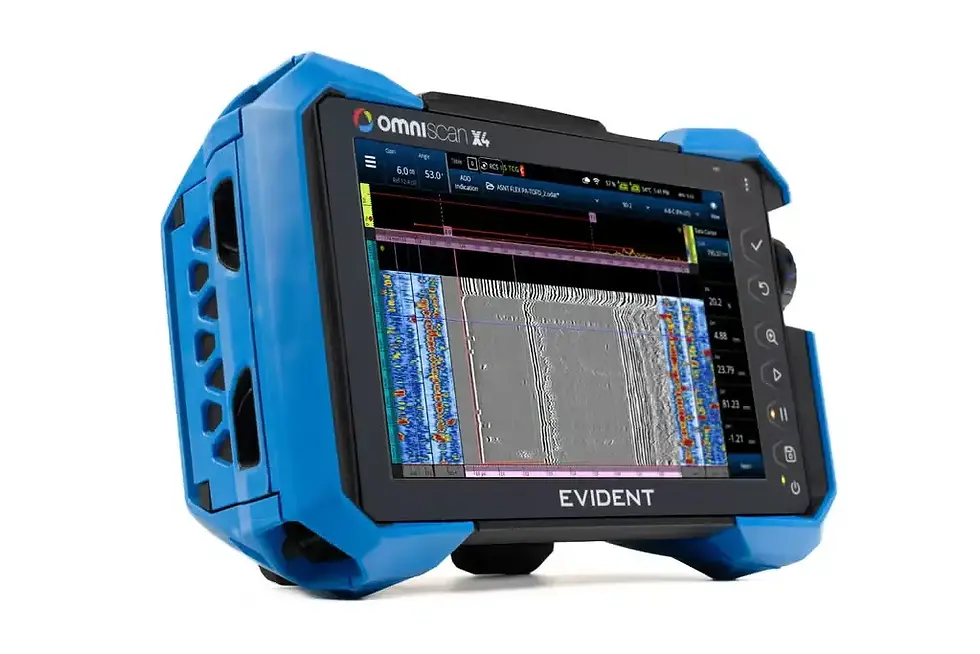
Multitechnology platform for PAUT, TOFD, TFM, and UT. — Evident Scientific — source: https://ims.evidentscientific.com/en/products/phased-array/omniscan-x4

Typical TOFD configuration for weld inspection. — Evident Scientific — source: https://ims.evidentscientific.com/en/applications/introduction-to-time-of-flight-diffraction-for-weld-inspection
Technical eddy current lexicon
The entries below combine technical definitions, equivalent terms, field notes, and the educational diagrams from the eddy current lexicon.
Eddy current testing
Related terms: ECT, eddy-current inspection, electromagnetic testing
Eddy current testing is an electromagnetic method used on electrically conductive materials to detect discontinuities and property variations. Its response can reveal changes in geometry, conductivity, permeability, thickness, or surface condition without requiring a couplant.
Field note: Set up the system on a representative reference standard and keep lift-off, scan speed, and temperature controlled during inspection.
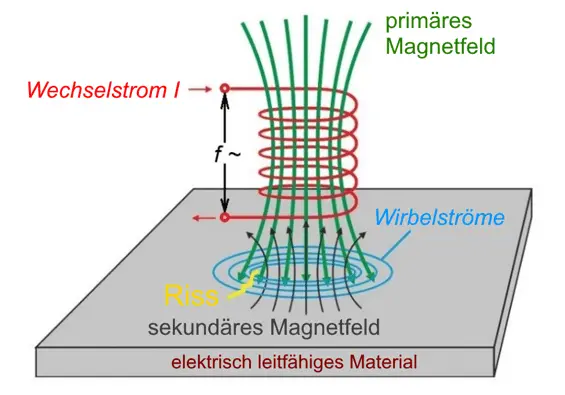
Interaction principle among coil, field, and conductive test piece. — Rohmann GmbH — source: https://www.rohmann.de/en/eddy-current-lexicon/#collapse23
Electromagnetic-field change caused by a discontinuity. — Rohmann GmbH — source: https://www.rohmann.de/en/eddy-current-lexicon/#collapse23
Eddy current generation
Related terms: eddy-current induction, induction principle, secondary field
Alternating current in a probe coil creates a changing magnetic field that induces closed current paths in the nearby conductive region. These currents produce a secondary field that reacts with the coil and changes when it encounters a discontinuity or material variation.
Field note: Interaction strength depends on electromagnetic coupling, frequency, probe geometry, and component properties.
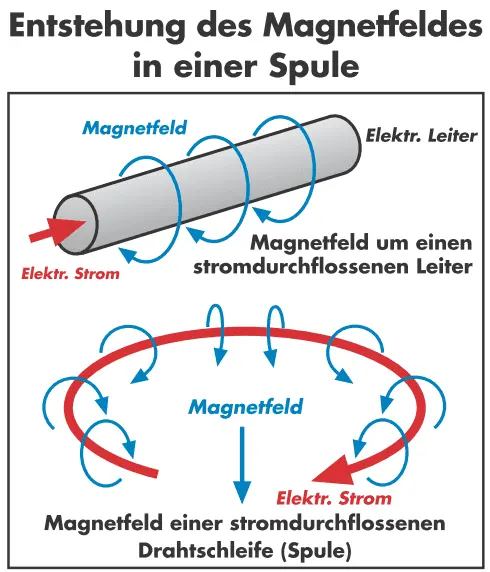
Step 1 of eddy-current generation. — Rohmann GmbH — source: https://www.rohmann.de/en/eddy-current-lexicon/#collapse24
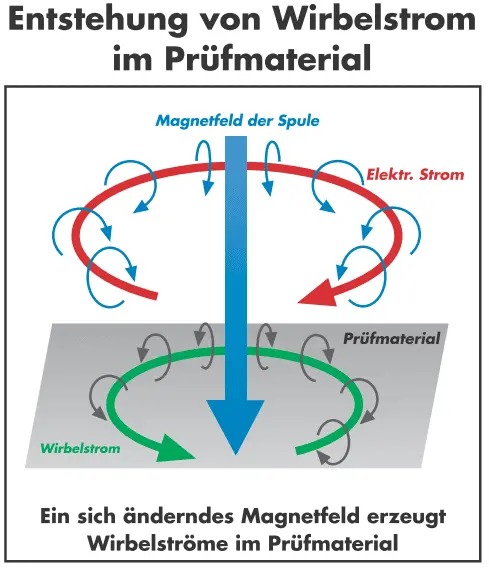
Step 2 of eddy-current generation. — Rohmann GmbH — source: https://www.rohmann.de/en/eddy-current-lexicon/#collapse24
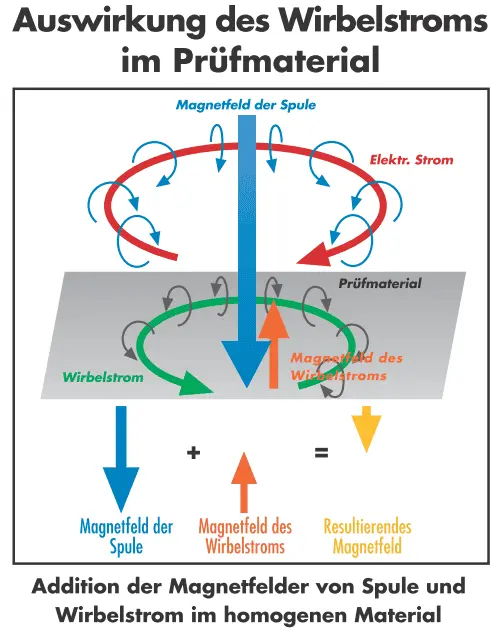
Step 3 of eddy-current generation. — Rohmann GmbH — source: https://www.rohmann.de/en/eddy-current-lexicon/#collapse24
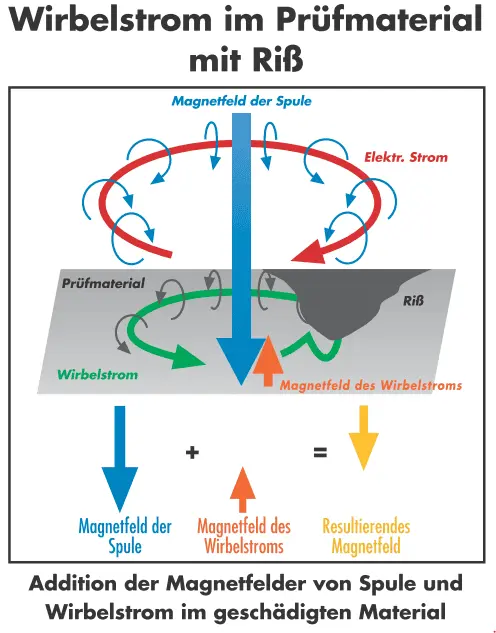
Step 4 of eddy-current generation. — Rohmann GmbH — source: https://www.rohmann.de/en/eddy-current-lexicon/#collapse24
Coil impedance
Related terms: probe impedance, impedance plane, AC impedance
Coil impedance combines the winding’s ohmic resistance and inductive reactance and can be represented as a complex quantity. Its amplitude and phase change with conductivity, permeability, geometry, lift-off, and discontinuities.
Field note: Balance the instrument and rotate the phase using a known reference before interpreting impedance-plane trajectories.

Ohmic-resistance formula. — Rohmann GmbH — source: https://www.rohmann.de/en/eddy-current-lexicon/#collapse10
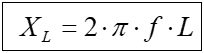
Inductive-reactance formula. — Rohmann GmbH — source: https://www.rohmann.de/en/eddy-current-lexicon/#collapse10
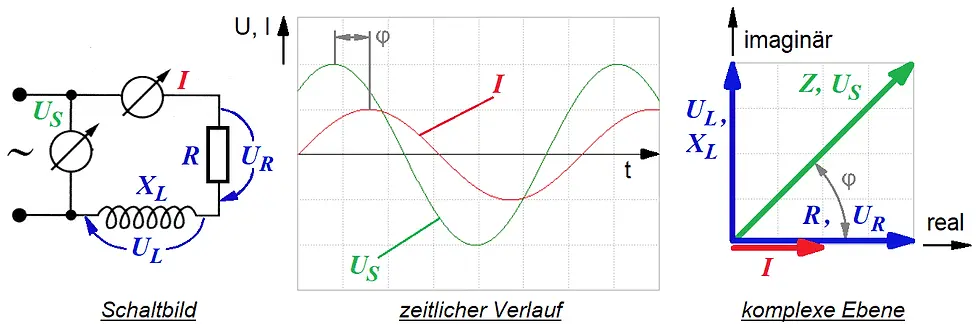
Physical parameters governing coil inductance. — Rohmann GmbH — source: https://www.rohmann.de/en/eddy-current-lexicon/#collapse10
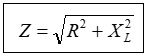
Vector composition of coil impedance. — Rohmann GmbH — source: https://www.rohmann.de/en/eddy-current-lexicon/#collapse10
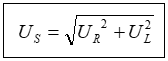
Vector composition of coil voltage. — Rohmann GmbH — source: https://www.rohmann.de/en/eddy-current-lexicon/#collapse10

Electrical phase-shift formula for a coil. — Rohmann GmbH — source: https://www.rohmann.de/en/eddy-current-lexicon/#collapse10
Electrical conductivity
Related terms: conductivity, sigma, σ, inverse resistivity
Electrical conductivity describes how readily charge moves through a material and is the inverse of resistivity. In eddy current testing, it affects induced-current strength, signal phase, and penetration depth.
Field note: Control or compensate for temperature because metal conductivity changes measurably with it.

Relationships among conductivity, resistivity, voltage, and current. — Rohmann GmbH — source: https://www.rohmann.de/en/eddy-current-lexicon/#collapse12
IACS system
Related terms: %IACS, International Annealed Copper Standard, relative conductivity
IACS is a relative conductivity scale that assigns annealed reference copper a value of 100% IACS, conventionally equivalent to 58 MS/m at 20 °C. The scale supports convenient comparison of alloys and metallurgical conditions with portable instruments.
Field note: Use certified standards near the expected range and apply the temperature compensation required by the procedure.
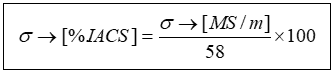
Conductivity conversion to the IACS scale. — Rohmann GmbH — source: https://www.rohmann.de/en/eddy-current-lexicon/#collapse9
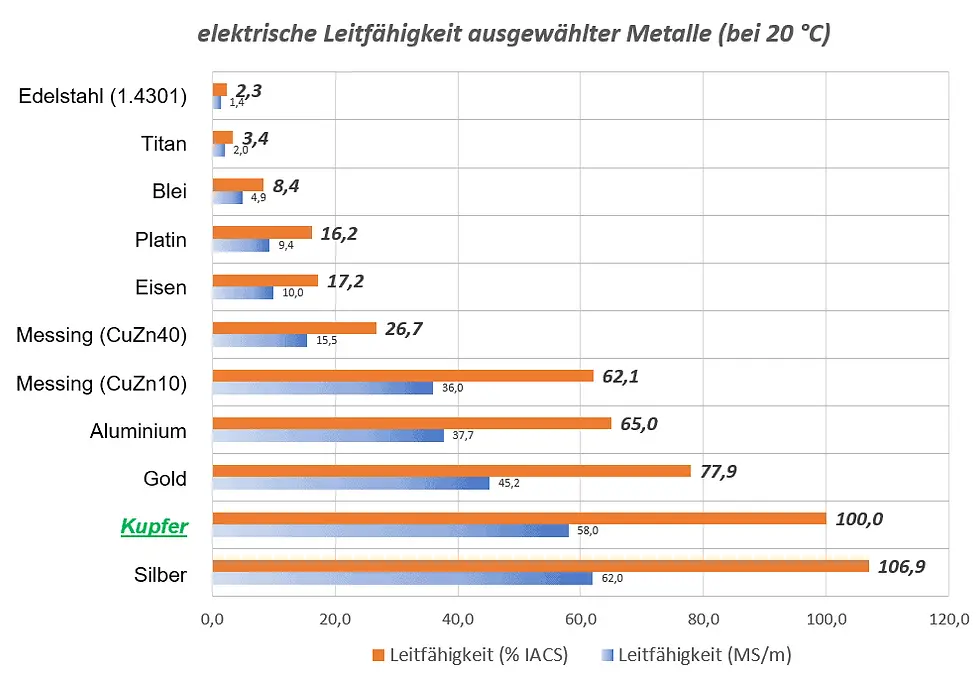
Graphical conductivity comparison in the IACS system. — Rohmann GmbH — source: https://www.rohmann.de/en/eddy-current-lexicon/#collapse9
Skin effect
Related terms: surface effect, current crowding, near-surface concentration
The skin effect concentrates eddy currents near the surface and progressively reduces their density with depth. This concentration increases as frequency, electrical conductivity, or magnetic permeability rises.
Field note: Higher frequencies favor surface sensitivity, while lower frequencies extend interaction into subsurface regions.
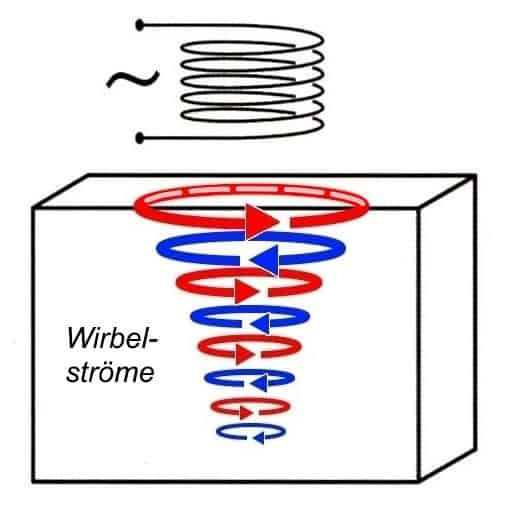
Layer model of the skin effect. — Rohmann GmbH — source: https://www.rohmann.de/en/eddy-current-lexicon/#collapse21
Penetration depth
Related terms: standard depth of penetration, δ, effective penetration
Standard penetration depth δ is the distance at which eddy current density falls to approximately 1/e, or 37% of its surface value. It depends primarily on test frequency, electrical conductivity, and magnetic permeability.
Field note: Treat δ as a physical estimate rather than a detection guarantee because geometry, orientation, signal-to-noise ratio, and probe configuration also limit capability.
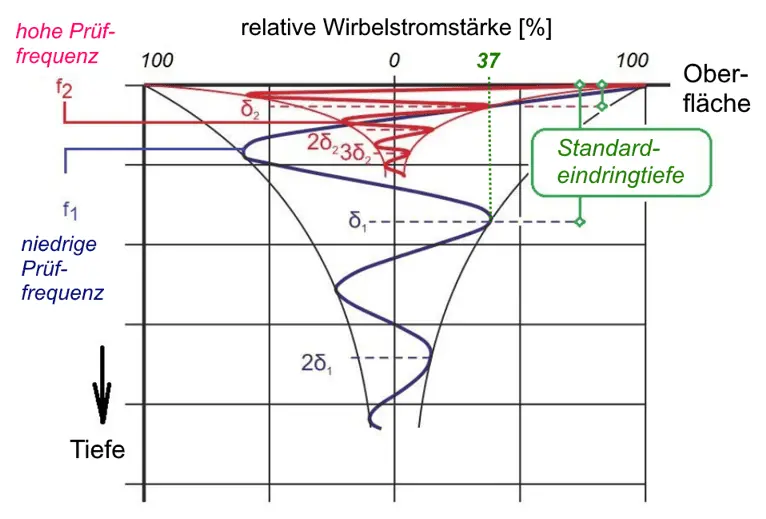
Eddy-current decay with depth. — Rohmann GmbH — source: https://www.rohmann.de/en/eddy-current-lexicon/#collapse6

Standard penetration-depth formula. — Rohmann GmbH — source: https://www.rohmann.de/en/eddy-current-lexicon/#collapse6
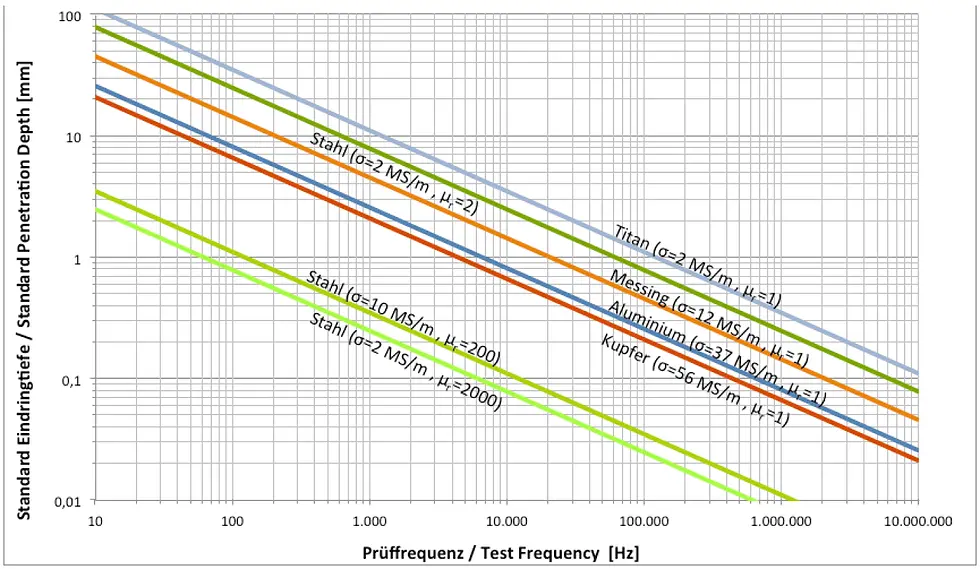
Relationship between standard depth and current density. — Rohmann GmbH — source: https://www.rohmann.de/en/eddy-current-lexicon/#collapse6
Eddy current phase shift
Related terms: phase displacement, phase lag, phase evaluation
Eddy currents acquire increasing phase lag as they interact deeper within a material. Signal phase also varies with geometry, conductivity, permeability, and lift-off, allowing indications to be separated when a suitable reference is available.
Field note: Calibrate phase direction with known discontinuities and confirm depth interpretations using representative standards or multiple frequencies.

Formula for eddy-current phase lag with depth. — Rohmann GmbH — source: https://www.rohmann.de/en/eddy-current-lexicon/#collapse15
Test frequency
Related terms: excitation frequency, probe frequency, operating frequency
Test frequency controls eddy current distribution, sensitivity, and phase separation between different conditions. High frequencies emphasize surface phenomena, while lower frequencies provide greater penetration.
Field note: Select a frequency within the probe’s rated range and validate the sensitivity, penetration, and noise trade-off on the reference standard.
Eddy current probes
Related terms: sensors, transducers, test coils
A probe contains one or more coils that excite the component and receive its electromagnetic response. Shape, dimensions, winding, core, shielding, and electrical connection determine its sensitive area and signal behavior.
Field note: Select the probe according to material, curvature, access, discontinuity orientation, and required resolution.
Probe types
Related terms: probe classification, sensor geometries, coil arrangements
Probes can be classified by mechanical form, coverage area, and measurement circuit. Common configurations include surface, pencil, encircling, internal, absolute, differential, reflection, and array probes.
Field note: No probe type is universal; selection should reproduce actual access conditions and the critical inspection orientation.
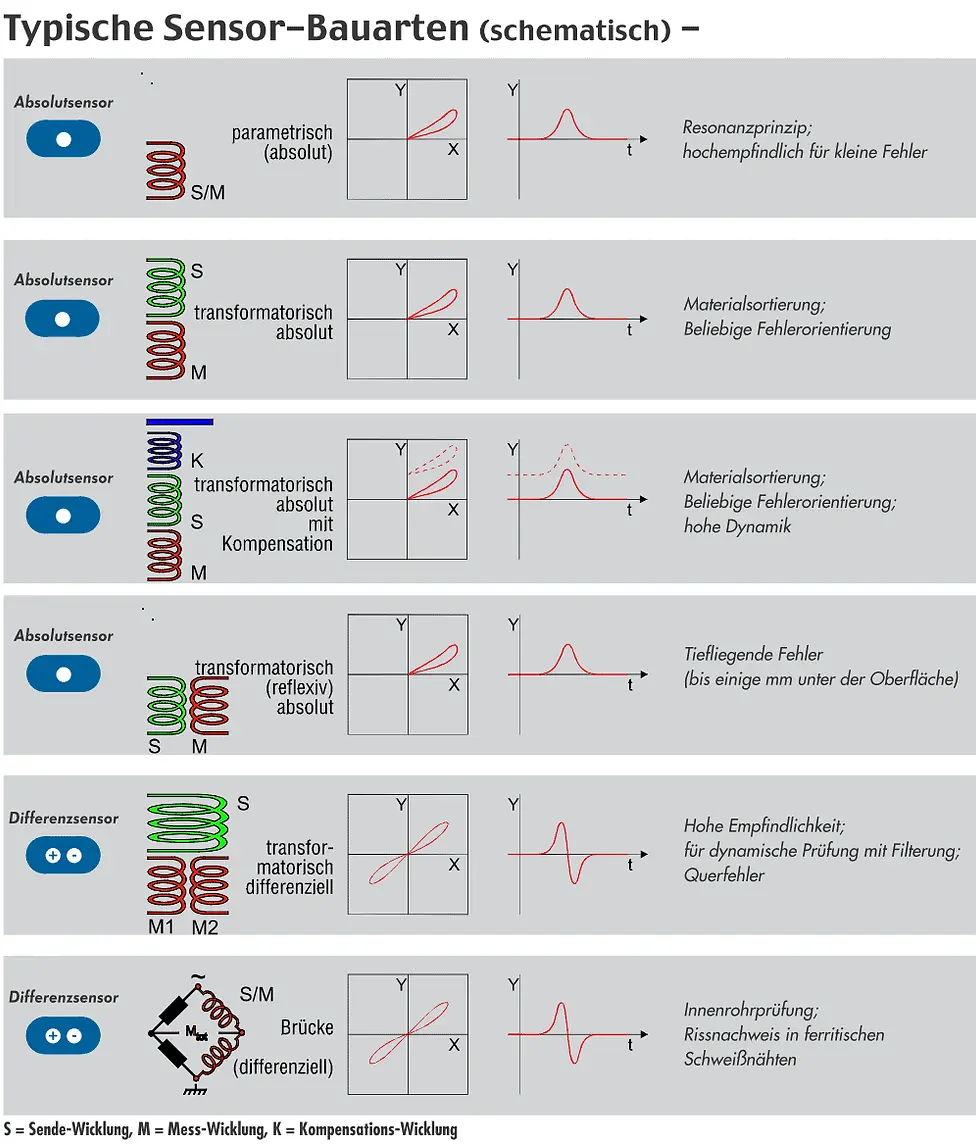
Typical eddy-current sensor geometries. — Rohmann GmbH — source: https://www.rohmann.de/en/eddy-current-lexicon/#collapse18
Absolute probes
Related terms: absolute sensor, absolute coil, absolute channel
An absolute probe responds to the total electromagnetic condition seen by its coil relative to the instrument balance point. It is sensitive to discontinuities as well as gradual changes in material, geometry, temperature, and lift-off.
Field note: Control drift and lift-off and rebalance whenever the reference condition changes.
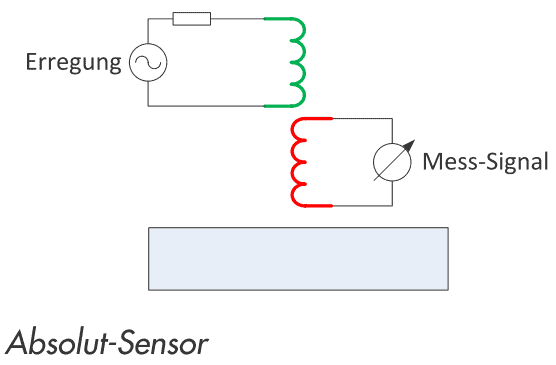
Absolute probe schematic. — Rohmann GmbH — source: https://www.rohmann.de/en/eddy-current-lexicon/#collapse1

Absolute probe with a compensation coil. — Rohmann GmbH — source: https://www.rohmann.de/en/eddy-current-lexicon/#collapse1
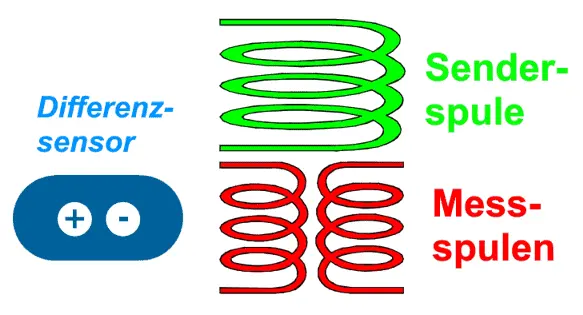
Differential probe system
Related terms: differential probe, opposed coils, differential channel
A differential system compares responses from two nearby regions, typically using electrically opposed coils. Uniform changes tend to cancel, while localized changes produce a characteristic response governed by coil spacing and scan direction.
Field note: Validate scan orientation and speed using reference discontinuities representative of the actual case.
Feed-through probes
Related terms: encircling coil, internal probe, bobbin probe, through-coil
Feed-through probes inspect elongated products using either an external coil surrounding the part or a probe traveling through its interior. They provide efficient circumferential coverage, although angular localization of an indication may be limited.
Field note: Keep the part or probe centered and control travel speed to achieve uniform coverage in automated systems.
Segment probes
Related terms: segment sensor, arc coil, partial-coverage probe
A segment probe covers only part of a component’s circumference, balancing inspection area against indication localization. Its spatial resolution is generally better than a fully encircling coil but lower than that of a small surface probe.
Field note: Plan overlap or indexed passes to prevent gaps in coverage.
Probe identification and specification
Related terms: probe data sheet, sensor nomenclature, probe traceability
A technical probe identification should state its electrical topology, active geometry, frequency range, connector, pinout, cable, and application limits. Serial number, verification status, and compatible materials or curvatures complete its traceability.
Field note: Never assume compatibility from the connector alone; verify pinout, impedance, operating range, and the configuration supported by the instrument.

Sensor-classification pictograms used by Rohmann. — Rohmann GmbH — source: https://www.rohmann.de/en/eddy-current-lexicon/#collapse11
Bandwidth
Related terms: passband, signal bandwidth, frequency response
Bandwidth defines the range of demodulated signal frequencies that the system can transmit or process. A wide bandwidth preserves fast transients but admits more noise, while a narrow bandwidth smooths the signal and may attenuate short indications.
Field note: Relate bandwidth to scan speed and effective coil width, and do not confuse it with excitation frequency.
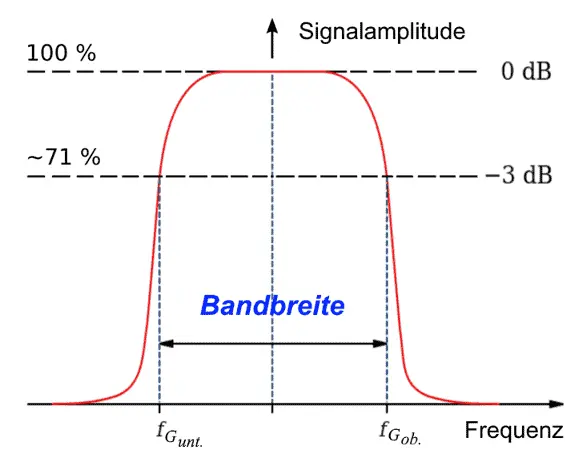
Bandwidth and cutoff-point representation. — Rohmann GmbH — source: https://www.rohmann.de/en/eddy-current-lexicon/#collapse2
Signal filtering
Related terms: filters, signal conditioning, time-domain filtering
Filtering reduces unwanted components when their frequency content differs from that of relevant indications. It can improve readability but cannot reliably separate signals that occupy the same spectral range.
Field note: Validate every setting at the actual inspection speed and record cutoff frequencies and other parameters in the procedure.

Spectrum containing relevant signals and interference. — Rohmann GmbH — source: https://www.rohmann.de/en/eddy-current-lexicon/#collapse7
High-pass filter
Related terms: high-pass, HPF, dynamic filter
A high-pass filter attenuates slow baseline variations while preserving components that change more rapidly. It can reduce gradual geometry, conductivity, or lift-off effects but may also weaken broad discontinuities or signals acquired at low speed.
Field note: Avoid excessive cutoff settings and confirm response using the intended probe, speed, and discontinuity size.

Frequency response of a high-pass filter. — Rohmann GmbH — source: https://www.rohmann.de/en/eddy-current-lexicon/#collapse8
Low-pass filter
Related terms: low-pass, LPF, smoothing filter
A low-pass filter attenuates high-frequency noise and interference while retaining slower signal components. If its cutoff is too low, short transients can lose amplitude and definition.
Field note: Place the cutoff above the highest relevant frequency produced by the smallest target discontinuity at maximum test speed.
Band-pass filter
Related terms: bandpass, BPF, frequency window
A band-pass filter combines lower and upper limits to preserve only an intermediate region of the spectrum. It reduces slow drift and fast noise simultaneously but may distort signals extending beyond the selected window.
Field note: Use it only after characterizing the spectra of relevant indications and interference at a stable scan speed.

Frequency response of a band-pass filter. — Rohmann GmbH — source: https://www.rohmann.de/en/eddy-current-lexicon/#collapse3
Multiplexing
Related terms: MUX, multiplexed acquisition, channel sharing
Multiplexing shares acquisition electronics among multiple probes, coils, or configurations by switching them in time. It reduces hardware and simultaneous interference but decreases the acquisition time available to each channel.
Field note: Size the multiplexing rate according to channel count, scan speed, sampling needs, and required coverage.
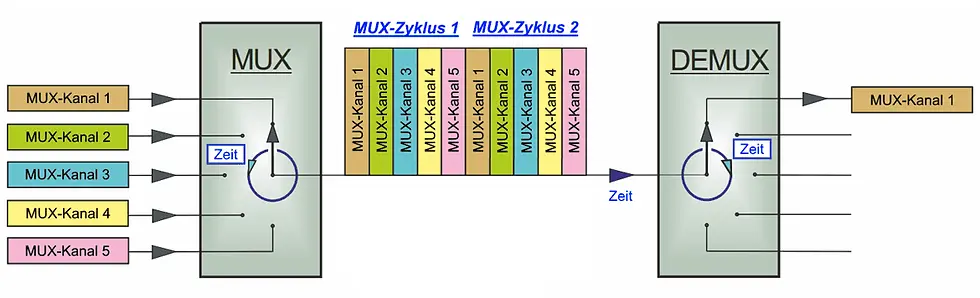
Time division of channels in a multiplexing cycle. — Rohmann GmbH — source: https://www.rohmann.de/en/eddy-current-lexicon/#collapse13
Parameter multiplexing
Related terms: sequential multifrequency, parameter switching, frequency MUX
In parameter multiplexing, one probe operates sequentially with different frequencies or gain, phase, filter, and threshold settings. Combining the responses can help separate material, geometry, and discontinuity effects, although each condition receives a lower effective update rate.
Field note: Synchronize cycles and normalize gain and phase before combining channels acquired with different settings.
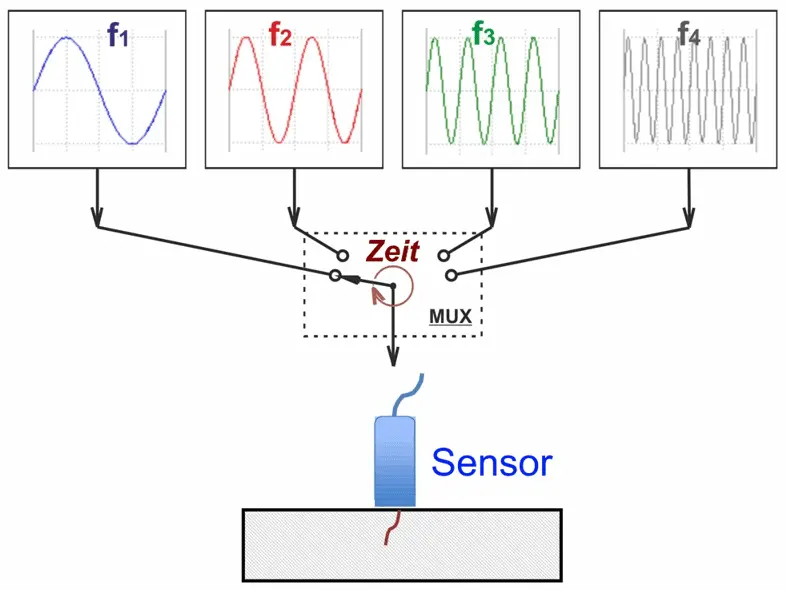
Parameter sequence in multifrequency acquisition. — Rohmann GmbH — source: https://www.rohmann.de/en/eddy-current-lexicon/#collapse14
Probe multiplexing
Related terms: sensor multiplexing, array scanning, element switching
Probe multiplexing sequentially activates multiple coils or array elements using shared electronics. It expands coverage and can produce two-dimensional maps, but requires coordination between spatial pitch, scan speed, and switching rate.
Field note: Use encoder synchronization and verify that pitch, trigger rate, and speed do not create gaps between elements or samples.
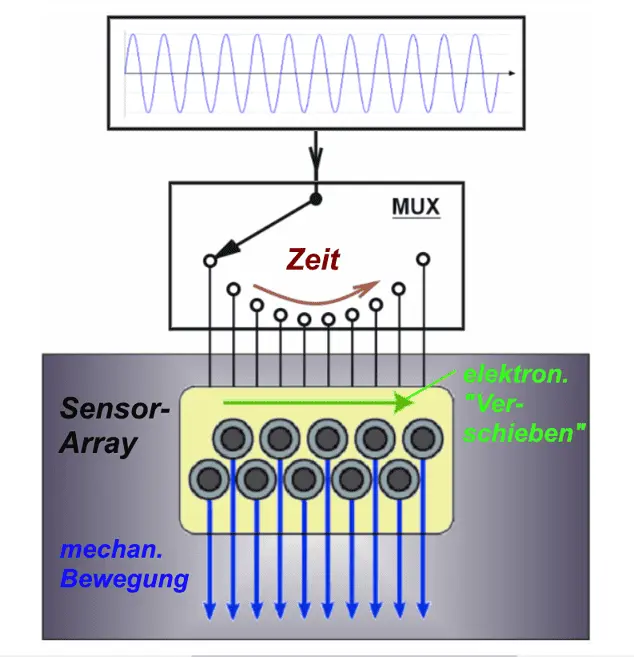
Sequential switching of elements in a sensor array. — Rohmann GmbH — source: https://www.rohmann.de/en/eddy-current-lexicon/#collapse19
Sources and technical use
Credits and provenance: technical images from Rohmann GmbH, Evident Scientific, Eddyfi Technologies, and SmartEND Instruments, as identified below each figure. Educational use authorized by the project owner.

Comments